

️ SERVER HEALTH DASHBOARD
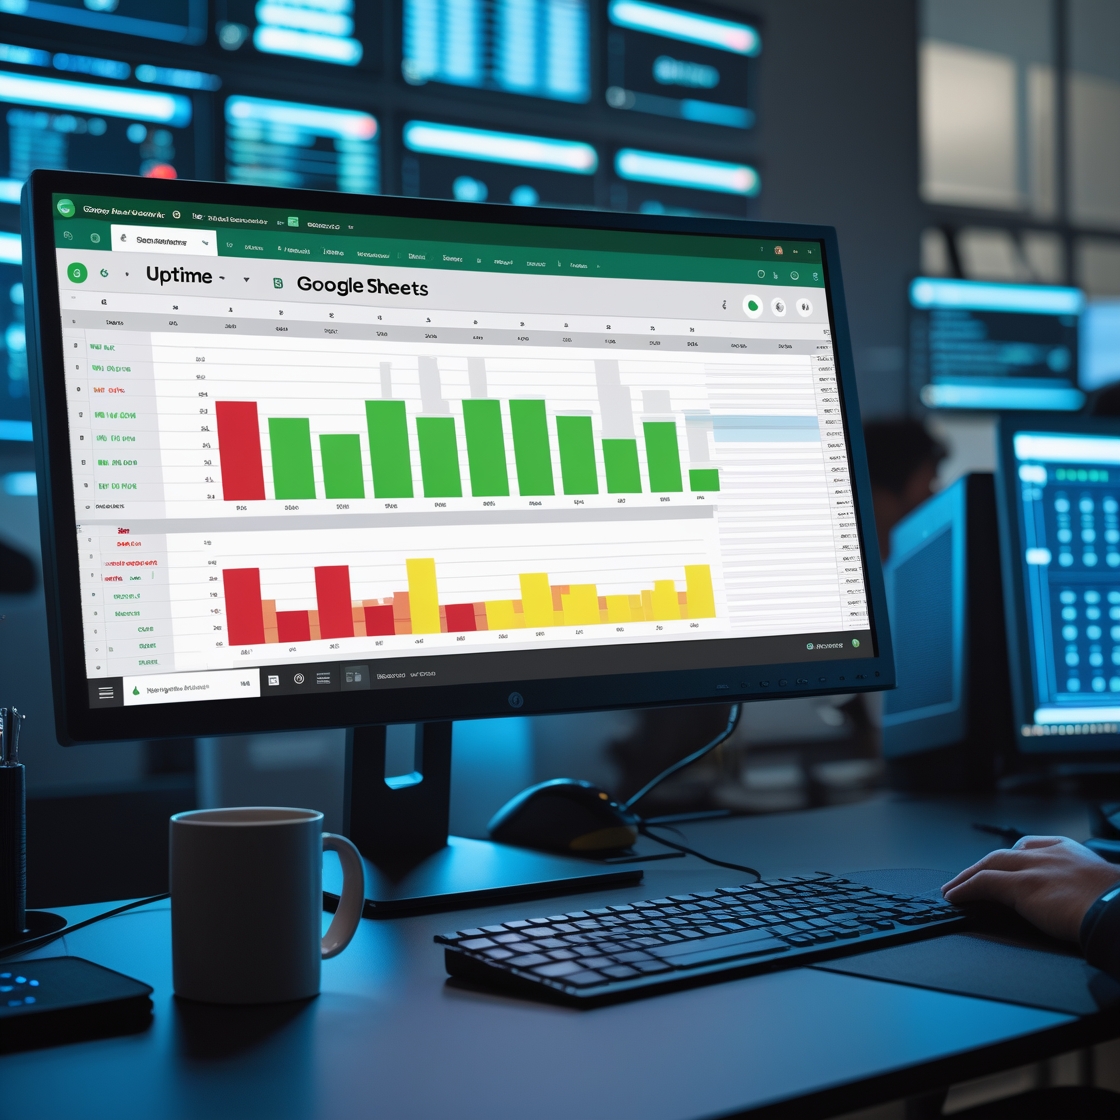
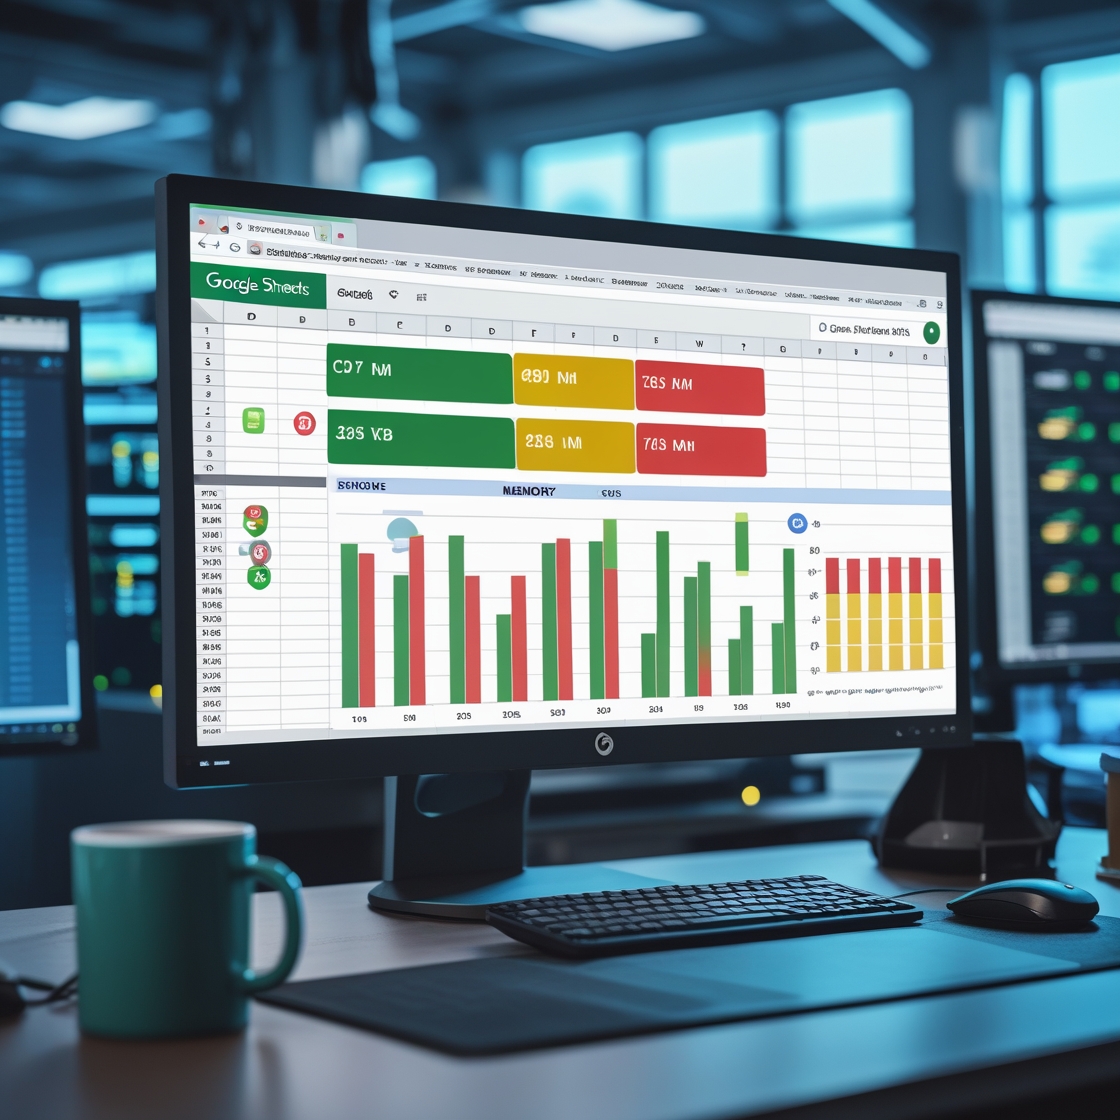
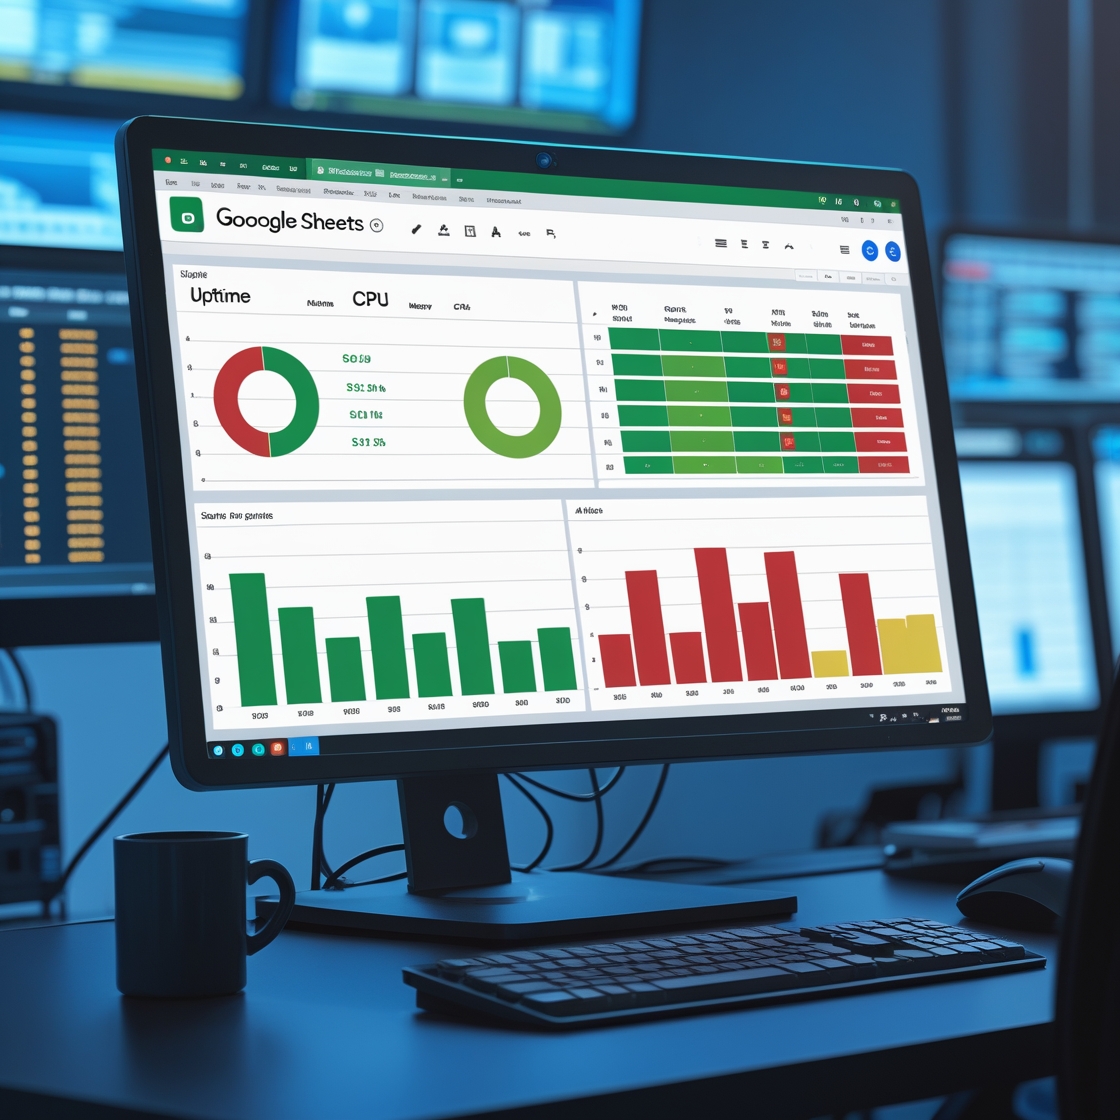
A ready-to-use Google Sheets dashboard designed to monitor server uptime, CPU usage, memory performance, and system alerts—all in one centralized view. The Server Health Dashboard makes it simple for IT teams to track key metrics, identify issues early, and keep infrastructure running smoothly.
What’s Included
• Editable Google Sheets dashboard template
• Pre-built sections for uptime, CPU, memory, and storage tracking
• Automated alert indicators for performance thresholds
• Customizable fields for multiple servers or environments
• Setup guide for easy configuration
Key Benefits
• Provides real-time visibility into server health
• Helps prevent downtime with early alerts
• Centralizes monitoring in a simple, familiar tool
• Customizable for small teams or enterprise use
• No expensive software required—runs in Google Sheets
Perfect For
• System administrators and IT managers
• Small businesses managing their own servers
• DevOps and cloud operations teams
• MSPs and IT consultants
• Anyone needing lightweight server monitoring tools
Format & Delivery
• Instant digital download
• Google Sheets template (with Excel backup option)
• Accessible on desktop, tablet, or mobile
• Reusable and scalable for multiple projects

Reviews
There are no reviews yet.